


President Trump Stated Strategy “As a Nation be more Unpredictable” European Response—Can no Longer Rely on Whims of Midwestern Voters— Increases Importance of Geopolitical Forces in the Investment Outlook
The President foreshadowed his unpredictable “strategy,” in his 2016 campaign: “We must, as a nation, be more unpredictable. We are totally predictable. And we have to be unpredictable starting now.” While this approach may enhance personal and business relations, it complicates interactions between sovereign states, when interests take precedence. A European official observed that we cannot rely on Midwestern voters’ whims to shape our economic, security, and foreign policies. Consequently, foreign investors may limit long-term investments in the U.S. to safeguard their interests, highlighting the growing significance of geopolitical forces in the business and investment outlook compared to earlier periods.
Unpredictability Produces Unpredictable Outlook for Business Planning—Capital Investment Spending Growth will Likely Slow
Unpredictability benefits neither business leaders nor investors, nor aids in writing this Commentary. We expect the President will continue launching extreme proposals as soon as they come to mind. Perhaps naively, we believe other senior officials in the administration will temper these outbursts.
Trade Agreements Take 18 Months to Finalize and 45 Months to Implement—not a 90 day Pause
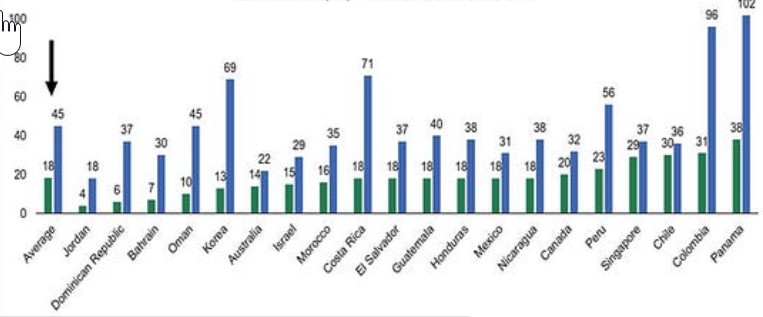
Unpredictability increased when the U.S. Court of International Trade blocked the Trump Administration’s “Liberation Day” tariffs under the International Emergency Economic Powers (IEEPA). The court suggested applying the Trade Act of 1974 to impose tariffs of up to 15% for 150 days before involving Congress. This ruling will push investors and businesses to navigate the complexities of the Trade Act. Despite the 90-day pause on reciprocal tariffs, trade agreements typically take 18 months to finalize and 45 months to implement (see Figure 1). The most challenging negotiations will likely involve China and the European Union—somewhat of a misnomer since the 27 EU countries prioritize their own interests.
Figure 1
Duration of U.S. Trade Negotiations
Source: Mehlman Consulting
Higher Tariff Rates—Substitution Effect Reduces China’s Import Share Over 50 Percent—Canada and Mexico Gain
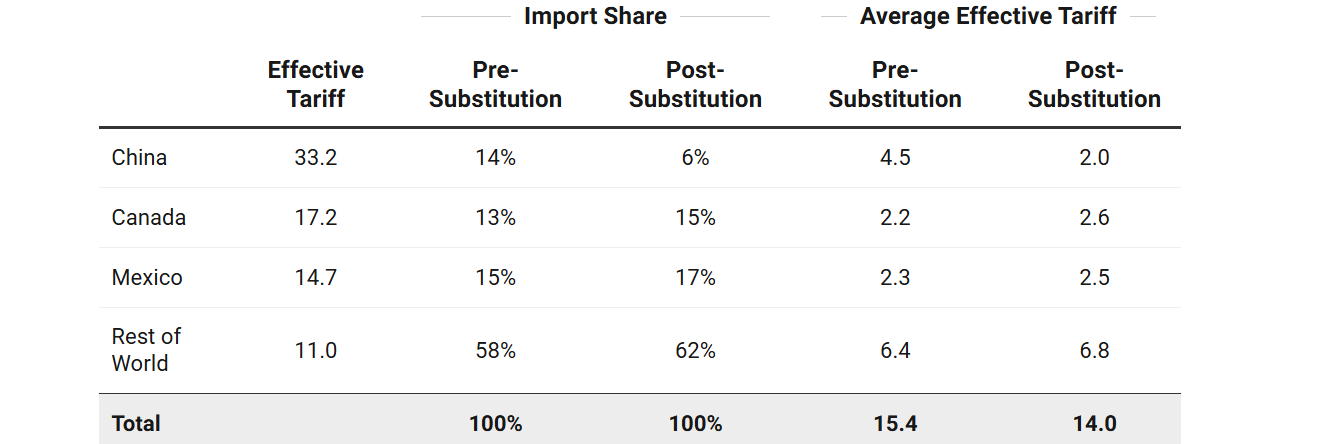
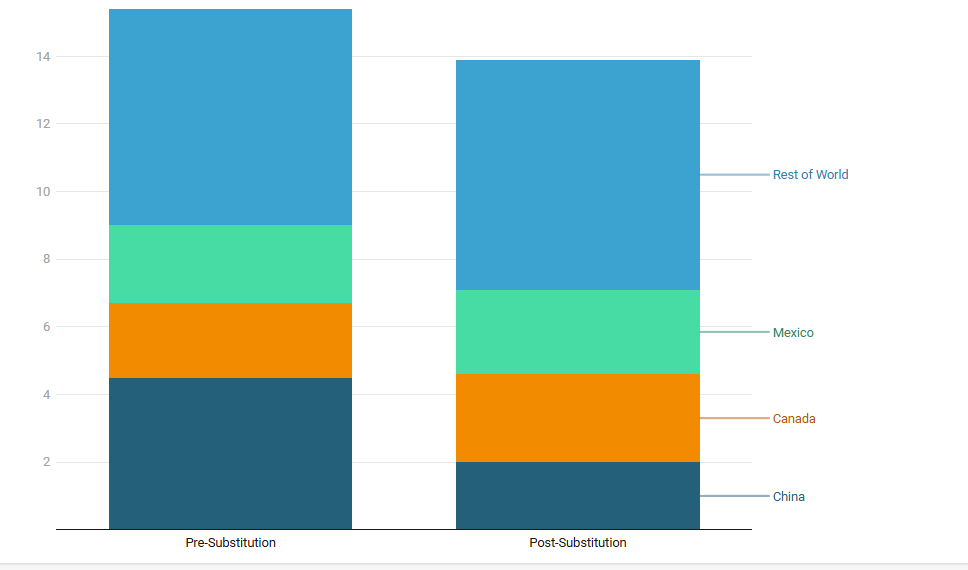
Amid the haze of tariff proposals, the Yale Budget Lab study compared the potential higher average effective tariff rates that consumers and businesses faced before and after substitution (see Figures 2 and 3). The estimated substitution effect from potential higher tariffs will likely reduce China’s estimated U.S. import share by over 50 percent, while Canada and Mexico will see modest improvements.
Figure 2
Change in Average Effective U.S. Tariff Rate, New 2025 Policy Through May 12
Source: The Budget Lab
Figure 3
Change in Average Effective U.S.Tariff rate by Country Contribution and Pre/Post Substitution(Percentage Points)
Source: The Budget Lab
Tariff Cost Increases—Reduces Profit Margins and Earnings for Largest Companies—Many Smaller FinanciallyWeaker Companies acquired or closed—Sector Market Consolidation Results
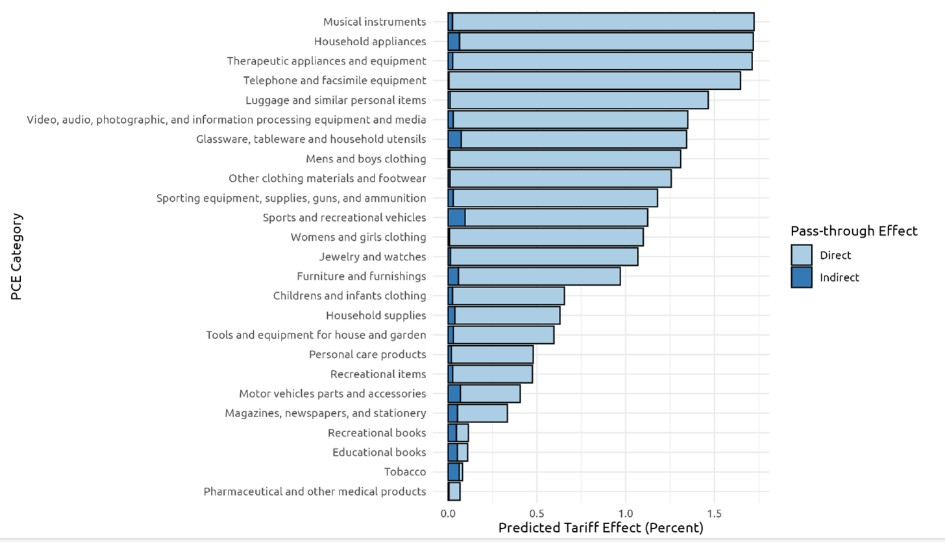
The Fed’s Economic Research Department estimated that a 10 % tariff increase on Chinese imports could raise prices of most core goods in the PCE by 1% (see Figure 4). Unlike during the first Trump administration, inflation concerns will likely restrict businesses from passing on full tariff costs. Consequently, major companies affected by tariffs may see profit margins erode and earnings growth slow or decline. Smaller, financially weaker companies with high floating-rate debt could face existential pressures, leading to potential acquisitions or closures. This could drive market consolidation in various sectors, enabling surviving businesses to operate more profitably amidst weaker competition.
Figure 4
Theoretical Pass-through of a 10 Percentage-point Tariff Increase on China to Core Goods (excl. motor vehicles) Prices
Source: Federal Reserve—Economic Research
Current Budget Defict Pressures Similar to 2004—Dollar Then Depreciated 25%-Reduced Trade Deficit
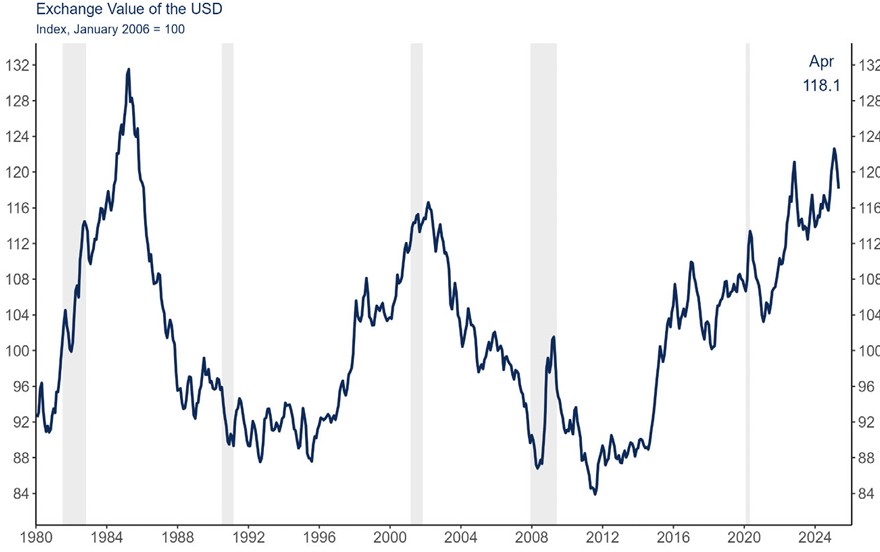
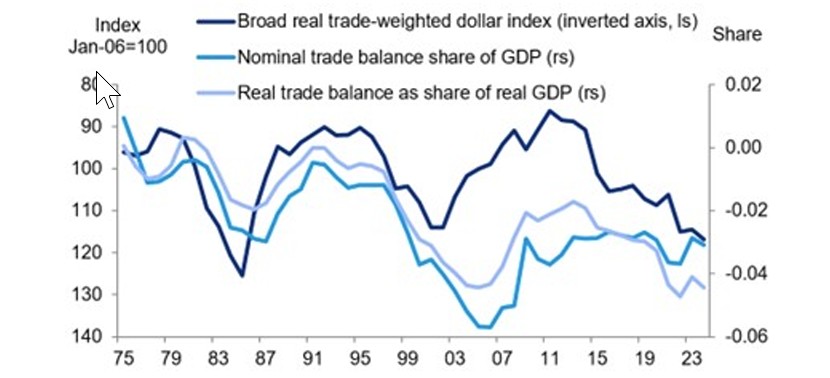
The current outlook for the U.S. dollar resembles its performance in 2004, when the inflation-adjusted current account deficit reached $1.13 trillion, similar to the 2024 deficit. In 2000, concerns arose as the U.S. budget deficit-to-GDP ratio rose to about 4 %, compared to over 6% today. A 2005 World Bank study warned that reduced foreign appetites for U.S. assets might drive up interest rates—sound familiar? The study correctly predicted a 25% depreciation of the U.S. dollar in the subsequent years (see Figure 5). If this pattern holds, a recent Deutsche Bank Research study suggests significant dollar depreciation could reduce the deficit by about 3% of GDP, roughly a 75% reduction in the current account deficit (see Figure 6). A weaker dollar could thus lower the current account deficit without the difficulties posed by raising tariffs. However, ongoing increases in the budget deficits may lead to higher interest rates to attract
buyers for U.S. Treasuries, creating an unusual scenario of dollar depreciation alongside rising interest rates.
Figure 5
Exchange Value of the U.S. Dollar
Source: Richmond Federal Reserve Bank via Haver Analytics
Figure 6
Dollar Leads Swings in U.S. External Trade Balance
Sources: Deutsche Bank Research, FRB, BEA, Haver Analytics
“Big, Beautiful Bill” Renews 100% Bonus Depreciation Without any Phase Out-New 100% Bonus Depreciation for Select Manufacturing Buildings—Stimulates the U.S. Economy as early as 2025
The “One, Big, Beautiful Bill” currently in Congress will increase budget deficits and put federal debt on an unstainable path. While investors focus on this issue, they may overlook key changes in the House bill regarding bonus depreciation and interest expense deductions that could stimulate the U.S. economy. The bill extends immediate 100% bonus depreciation for most equipment and machinery for five years, removing the phase-out schedule. For the first time, it permits immediate 100% bonus depreciation for certain buildings used in manufacturing, production, or refining, replacing the lengthy 39-year depreciation period. Additionally, the bill raises the allowable amount for interest tax deductions, benefitting small and mid-sized companies with higher debt levels.
Bonus Depreciation Should Incentivize Investments in Capital Intense Industries—Accelerate Productivity—Benefits Machinery and Equipment Companies
The enhanced bonus depreciation provisions and improved tax treatment of interest expenses should incentivize new investments in capital-intensive industries and attract manufacturing and production to the U.S., benefitting suppliers (see Figure 6). Coupled with AI applications in manufacturing, these tax incentives could accelerate productivity, mitigate slowing labor force growth, and promote economic expansion.
Figure 6
Estimated Economic Impact of Permanent Bonus Depreciation
| Effect (Permanent Policy) | Estimated Impact |
|---|---|
| GDP Growth | +0.2% to +0,5% (long run) |
| Capital Stock | +0.7% |
| Employment | +73,000 to +83,000 FTE’s* |
| Business Investment | +10 to 18% (eligible assets short term) |
*Full-time equivalent jobs
Sources: Congressional Budget Office, Tax Foundation, Joint Committee on Taxation
Investment Conclusions—Just Two Leaders broadly affect future events—Not the Recent Norm:
The market’s sharp reactions to recent events, reflect heightened uncertainty and few historical precedents for forward looking estimates. Unlike in the recent past, two leaders, Trump and Xi, broadly influence future events, undermining long-term business and investment decisions. This absence of analogues and the dominance of these two leaders prompt many economists to use SWAGs for long-term forecasts. Greater-than-normal-uncertainty should lead investors to seek a combination of diversified and high-quality investments, particularly those with financially strong balance sheets.
International Equities—Improved Relative Performance of International Markets—U.S. Global Companies an Alternative:
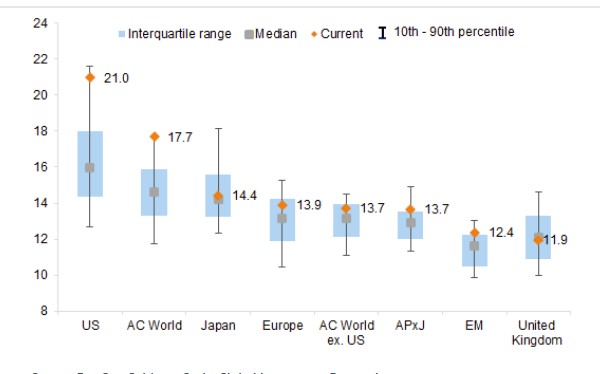
Rising U.S. economic uncertainty boosts interest in international equity markets. U.S. equities trade at a 1.5 times premium to the MSCI world ex-U.S. index and significantly above historical median valuations in the U.S.(see Figure 7). With relatively few major international “tech” companies versus the large number in the U.S., a valuation gap with international markets will likely persist. Alternatively, investing in U.S. global firms with sizeable international revenues offers a conservative strategy, particularly if the U.S. dollar weakens.
Figure 7
MSCI Regions Comparative Valuations(12-month forward P/E’s relative to the last 20 Years)
Sources: Goldman Sachs Global Investment Research, FactSet
Domestic Equities—Bonus Tax Benefits Machinery and Equipment Companies:
Top U.S. companies will continue attracting international investors, although average multiples may trend toward past averages. Quality firms with sustained above-average earnings growth and strong balance sheets will likely command relative multiple premiums. Investors should favor U.S.-centric businesses that benefit from the world’s largest consumer market. Companies supplying machinery and equipment should show earnings growth due to the renewal of bonus depreciation bill without a phase out provision
Fixed Income—Budget Deficit Financing Higher Rates Remain:
The financing demands from the rising budget deficit likely keeps long-rates higher. Therefore, investors should focus primarily on short to intermediate-duration Treasury notes.
Alternatives:
Amidst changes in the financial industry and markets, selective alternatives provide investors with the opportunity to engage in these changes by investing in the growing use of private credit. Additionally, alternatives also provide diversification benefits by being less correlated with stocks and bonds.